Analysis of Acceptance Rate – The Ivy Leagues
Considered the pinnacle of higher education in the United States, the eight Ivy League colleges attract high-achieving students from around the globe. To be successfully admitted into one of these colleges is a testimony to their academic prowess. The desire to get in is so great that beginning in grade 9, students work tirelessly to build a profile to impress the admissions officers.
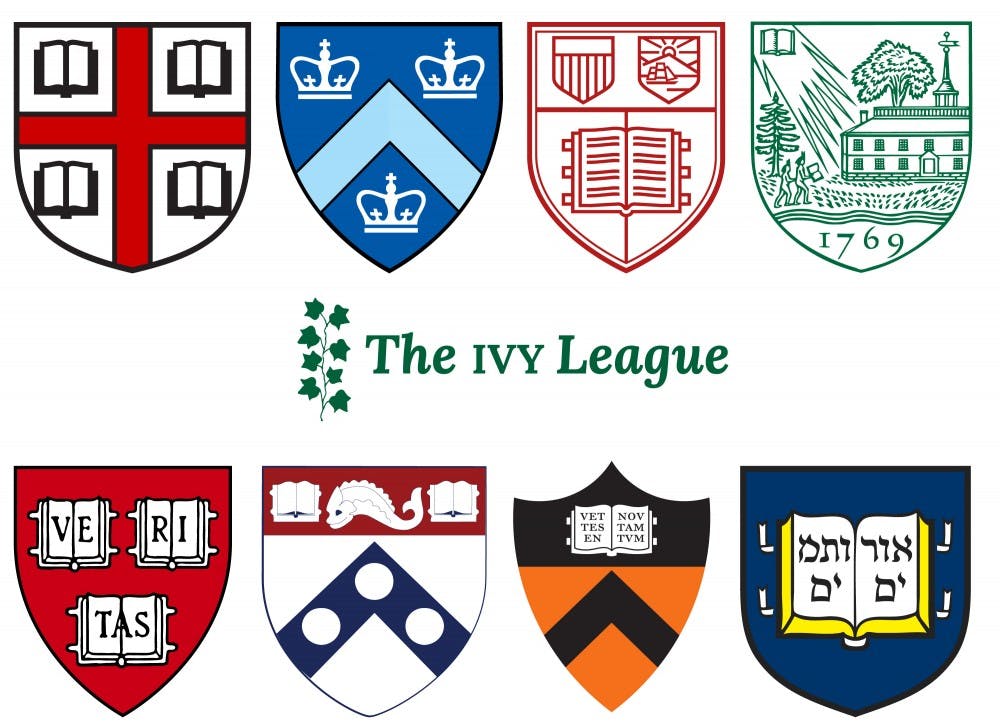
No one has ever said that the path to these prestigious institutions was easy, but in the last decade or so- particularly post-COVID-19, admission to these colleges has become increasingly challenging. The Ivy League, comprising Harvard, Yale, Princeton, Columbia, the University of Pennsylvania, Brown, Dartmouth, and Cornell, is synonymous with academic excellence, rigorous admissions standards, and a commitment to producing future leaders. Understanding the admissions trends of these schools can provide valuable insights for students, parents, and educators alike. This blog delves into the acceptance rates of Ivy League schools from 2020 to 2025, analyzing the trends and discussing what these changes mean for prospective students.
The disruptions caused by the COVID-19 pandemic were far-reaching, extending to college admissions. With testing becoming nearly impossible, all colleges, including the Ivy League schools, adopted test-optional policies.
However, with the gradual return to normalcy, several Ivy League institutions have reinstated standardized testing requirements for the Class of 2029 (students applying in Fall 2024 for Fall 2025 entry). Dartmouth, Yale, Brown, and Harvard have all either reinstated or strongly recommended test scores. This marks a reversal of the pandemic-era test-optional trend and is already beginning to reshape application patterns.
The next admission cycles will reveal whether reinstating standardized tests or the Supreme Court ruling against affirmative action leads to a decline in application numbers.
Number of Applications- A glimpse through the years
| College | 2025 (Approx./Reported) | 2024 | 2023 | 2022 | 2021 | 2020 |
| Brown | 46,568 | 36,794 | 38,674 | 35,438 | 32,724 | 32,390 |
| Columbia | 59,616 | 40,084 | 42,569 | 40,203 | 37,389 | 36,292 |
| Cornell | 68,000 (approx) | NA | 49,118 | 51,328 | 47,038 | 44,965 |
| Dartmouth | 28,230 | 21,394 | 23,650 | 22,033 | 20,034 | 20,675 |
| Harvard | 53,700 | 40,248 | 43,330 | 42,749 | 39,506 | 39,041 |
| MIT | 29,282 | 20,075 | 21,312 | 21,706 | 20,247 | 19,020 |
| Penn | 72,744 | 42,205 | 44,960 | 44,482 | 40,413 | 38,918 |
| Princeton | Unspecified | 32,836 | 32,804 | 35,370 | 31,056 | 29,303 |
Ever-Larger Applicant Pools
Larger applicant pools often correlate to smaller acceptance rates because of increased competition. This trend is driven mainly by test-optional policies introduced during COVID-19 and increased access to the internet globally, which have democratized the application process to some extent.
Test-Optional Policies
Initially a response to the pandemic, the move to test-optional admissions was met with positive and negative reactions. Students were happy to have other facets of their application considered more carefully, such as essays, extracurriculars, and recommendation letters. The Ivies noted a more diverse pool of applications since many students from lower socioeconomic backgrounds had limited access to test-preparation resources and classes. However, with schools like Yale, Brown, and Dartmouth reversing their test-optional policies, we may see fewer numbers in this year’s applicant pools.
Number of students accepted
| College | 2025 (est./reported) | 2024 | 2023 | 2022 | 2021 | 2020 |
| Brown | 2,418 | 2,533 | 2,551 | 2,566 | 2,919 | 2,580 |
| Columbia | 2,557 | 2,465 | 2,190 | 2,214 | 2,193 | 2,228 |
| Cornell | 5,824 | NA | 5,183 | 5,288 | 6,277 | 6,234 |
| Dartmouth | 1,702 | 1,881 | 1,876 | 1,925 | 2,176 | 2,120 |
| Harvard | Not Reported | 1,980 | 1,950 | 1,962 | 2,037 | 1,990 |
| MIT | 1,324 | 1,457 | 1,410 | 1,464 | 1,485 | 1,467 |
| Penn | 3,530 | 3,404 | 3,345 | 3,731 | 3,661 | 3,697 |
| Princeton | Not Reported | 1,823 | 1,895 | 1,941 | 1,894 | 1,908 |
| Yale | 2,308 | 2,304 | 2,178 | 2,229 | 1,972 | 1,963 |
Analysing the trend
Percentage of acceptance
| College | 2025 (updated) | 2024 | 2023 | 2022 | 2021 | 2020 |
| Brown | 5.65% | 6.88% | 6.60% | 7.24% | 8.92% | 7.97% |
| Columbia | 4.30% | 6.15% | 5.14% | 5.51% | 5.87% | 6.14% |
| Cornell | ~7.5% (est.) | NA | 10.55% | 10.30% | 13.34% | 13.86% |
| Dartmouth | 6.0% (est.) | 8.79% | 7.93% | 8.74% | 10.86% | 10.25% |
| Harvard | 3.60% | 4.92% | 4.50% | 4.59% | 5.16% | 5.10% |
| MIT | 4.56% | 7.25% | 6.62% | 6.74% | 7.33% | 7.71% |
| Penn | 4.90% | 8.07% | 7.44% | 8.39% | 9.06% | 9.50% |
| Princeton | 5.0% (est.) | 5.55% | 5.78% | 5.49% | 6.10% | 6.51% |
| Yale | 4.6% (est.) | 6.54% | 5.91% | 6.31% | 5.99% | 6.24% |
Brown University:
- Brown’s admission data reveals that in 2021 it admitted the largest number of students (2,919 admits), gradually decreasing each year, reaching 2,418 in 2024.
Columbia University:
- Columbia sees a slight decline from 2,228 admits in 2020 to 2,190 in 2023, with a noticeable increase to 2,557 in 2025. The increase in 2024 could be reflective of changes in admissions strategies or an attempt to balance yield rates.
Columbia Admissions Statistics
Cornell University:
- The data for Cornell in 2025 is 5,824 but there is a clear decrease from 6,234 admits in 2020 to 5,183 in 2023. We do not have any data from 2024. This trend suggests a tightening of admissions criteria over these years.
Dartmouth College:
- Dartmouth shows a consistent decline in admissions from 2,120 in 2020 to 1,876 in 2023, with a slight increase to 1,881 in 2024 and 1,702 in 2025
Dartmouth Admissions Statistics
Harvard University:
- Harvard maintained relatively stable admission numbers, fluctuating around 1,950 to 2,037 admits. The consistency in numbers suggests a stable admissions process.
University of Pennsylvania:
- Penn recovered slightly, showing a drop from 3,731 admits in 2022 to 3,345 in 2023, with a slight recovery to 3,404 in 2024, and to 3530 in 2025
Princeton University
- Princeton’s admissions have been relatively stable, with minor fluctuations around 1,894 to 1,941 admits, indicating a steady admissions strategy. In 2025, Princeton did not report its figures.
Princeton Admissions Statistics
Yale University:
- Yale’s admits increased from 1,963 in 2020 to 2,229 in 2022, with subsequent slight decreases and then a rise to 2,304 in 2024, while in 2025, 2308 students were admitted
Early Decision Applications Received
| College | 2025 (Updated) | 2,024 | 2,023 | 2022 | 2021 | 2020 |
| Brown | 5,540 | 6,244 | 6,770 | 6,146 | 4,562 |
Early Decision Admitted
|
| Columbia | 6,435 | 6,009 | 5,738 | 6,305 | 4,318 | 885 |
| Cornell | Not Released | NA | NA | 9,555 | 6,630 | 650 |
| Dartmouth | 2,664 | 3,550 | 3,009 | 2,633 | 2,069 | 1576 |
| Harvard (SCEA) | 10,086 | 7,921 | 9,553 | 9,406 | 6,424 | 591 |
| Penn | 7,962 | 8,500 | NYP | 7,794 | 6,453 | 747 |
| Princeton (SCEA) | Not Available | NA | NA | NA | 4,998 | 1,194 |
| Yale (SCEA) | 7,939 | 7,856 | 7,744 | 7,288 | 5,777 | 1823 |
| Yale SCEA | 837 | 709 | 842 | 881 | 83 | 83 |
Early Decision Accepted Numbers
| College | 2,025 | 2,024 | 2,023 | 2022 | 2021 | 2020 |
| Brown | 885 | 898 | 879 | 896 | 885 | 885 |
| Columbia | 650 | 721 | 650 | 650 | 650 | 650 |
| Cornell | 1,930 | 1,736 | 1,670 | 1,831 | 1,930 | 1,576 |
| Dartmouth | 566 | 604 | 578 | 560 | 591 | 591 |
| Harvard (SCEA) | 747 | 692 | 722 | 740 | 747 | 747 |
| Penn | 1,194 | NA | NA | 1,210 | 1,194 | 1,194 |
| Princeton (SCEA) | Not Published | 1,800 | 1,782 | 2,167 | 1,647 | 1,823 |
| Yale (SCEA) | 837 | 709 | 842 | 881 | 83* | 83* |
| Yale SCEA | 837 | 709 | 842 | 881 | 83 | 83 |
Analysis of the Trend
The acceptance rates for Early Decision (ED) versus Regular Decision (RD) at Ivy League schools show a clear advantage for ED applicants, with Liberal Arts College, Brown (13% vs 5.2%), Columbia (12.5% vs 3.7%), Dartmouth (21% vs 6.2%), University of Pennsylvania (14.8% vs 5.9%), and Cornell (17.5% vs 7.9%) all demonstrating significantly higher acceptance rates for ED.
This clearly suggests that applying Early substantially increases an applicant’s chances of admission These schools welcome students who show more commitment to the schools and are ready to accept the binding conditions. Since colleges aa discussed above look at improving their yield, admitting a large portion of their class through Early Decision (ED) enhances their yield rate since ED guarantees a 100% yield rate due to its binding nature.
Implications for Students
In some cases, the trend of increased selectivity and continuous fluctuation points us to the admission strategies that universities employ. It could be either to reduce the class size, balance yield rates, capacity planning, etc.
Diversity and Inclusion Efforts
The rise of social justice movements has forced Ivy League schools to address historical inequities and promote diversity within their student and faculty demographic. The recent U.S. Supreme Court judgment to overturn affirmative action admissions policies has prompted the Ivies to bolster their diversity efforts through less conspicuous means, as they recognize that a diverse student body enriches the educational experience for all students.
Increased Selectivity
The implications of the COVID-19 pandemic continue to unfold in different ways across the college admissions process. Exceptional grades are not enough: students must demonstrate their leadership skills and a clear sense of purpose through research projects and initiatives beyond the classroom.
Conclusion
The analysis of Ivy League acceptance rates from 2020 to 2024 reveals a clear trend: gaining admission to these prestigious schools is becoming increasingly difficult. No school is a safety school anymore, and many target schools are now more accurately categorized as reach or super-reach. (The updated Forbes College List is going to result in some more unusual trends and numbers – The Movers & Shakers in the latest Forbes College Ranking-2025 | Ivy Central). Students need to be a lot more strategic when compiling their college lists and making decisions on their ED and EA choices. Students should remain open to a range of educational opportunities, focusing on finding the best fit for their academic and personal goals.
If you need guidance on understanding the admissions process and creating a strategically viable list, Ivy Central‘s expert career guidance team can help you navigate this labyrinthine path. With our personalized approach and deep expertise, we’ll ensure you’re on the right track to achieving your academic and career aspirations. Let us help you turn your dreams into reality.
Sources: Google


